


.svg)


Stay Ahead with Cashflow Forecasting
Clarc’s new Forecasting feature gives you a clearer view of your company’s financial future. With Project Forecast, you can visualise both existing and upcoming invoice amounts, and track them against your project budgets in real time.

Stay informed, stay prepared, and take control of your financial outlook with Clarc Forecasting.

.png)
Clarc’s Forecasting feature empowers you to take a proactive approach to managing your finances.
By combining project-level insights with real-time budget tracking, it enables you to clearly see where your revenue stands today and where it’s heading. You can map out expected income by scheduling future payments, giving you a forward-looking view of cashflow and helping you plan with confidence. With the ability to model different financial scenarios directly within the cashflow chart, you can quickly assess the impact of potential decisions and adjust your strategy accordingly. This new feature will help you to make informed decisions and keep your business moving in the right direction.
1. Project Forecast
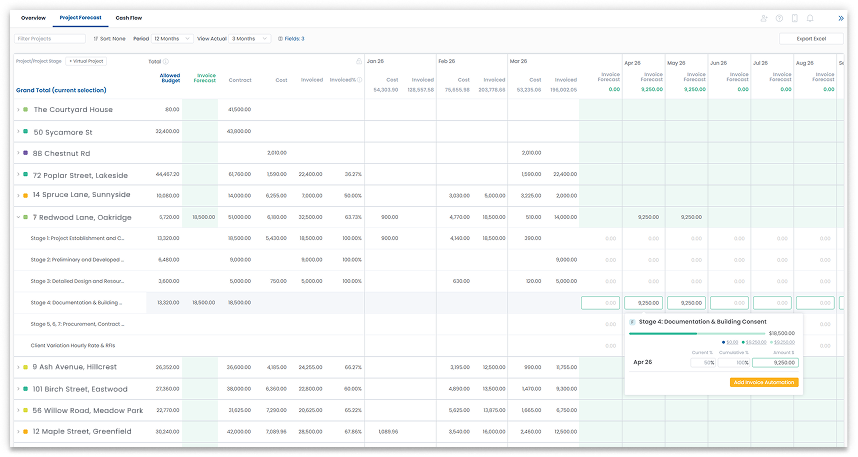
The Project Forecast provides a comparative chart that lets you track expected costs against projected cashflow over a selected period.
Historical costs are based on actual time entries logged by your team, while future costs are derived from allocated (resourced) hours.
Projected cashflow can be automatically generated or manually adjusted directly within the chart, giving you the flexibility to refine and align your financial outlook.

You can build your own forecast by entering either a percentage or a fixed amount for future months.
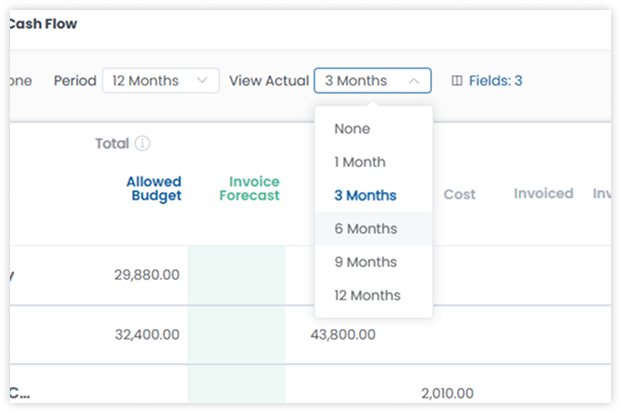
Selecting “View Actual” allows you to customise the date range for displaying actual costs and cashflow.
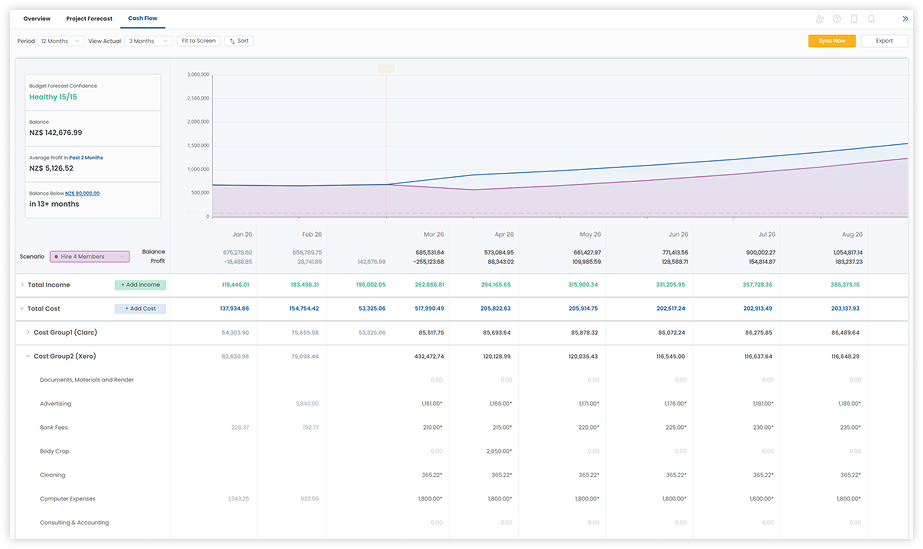
2. Cashflow & Scenario Forecast
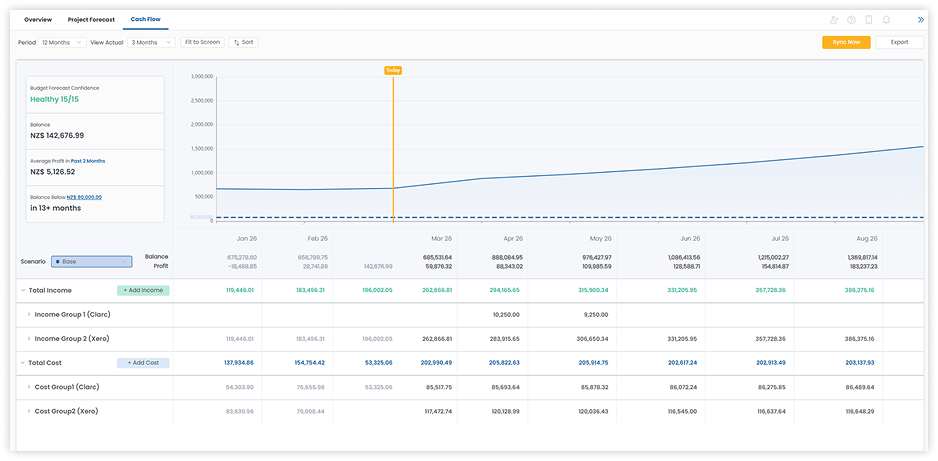
The Cashflow Chart provides a visual overview of your company’s total costs and income over a selected period.
You can set a baseline value (shown as a dashed line) to represent the minimum operating cost required to run the business. The Health Score (displayed in green) is calculated against this baseline, giving you a quick indication of financial performance.
For greater accuracy, you can sync your income and costs with Xero.
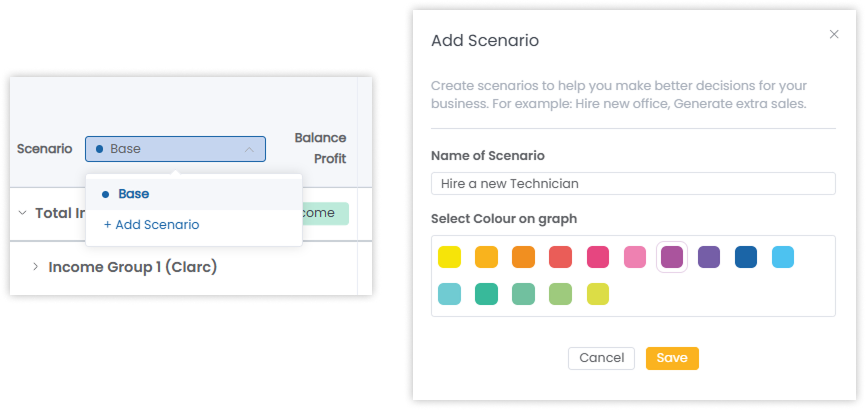
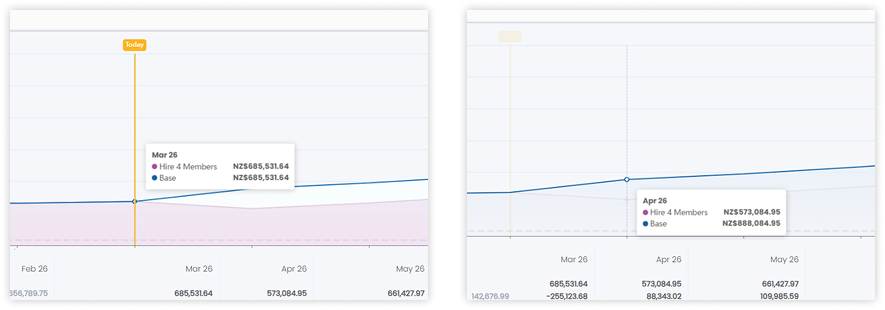
Adding a scenario to the chart is a feature that enables you to compare and predict on whether decisions can be made.For example, you can visualize how your company cashflow will be affected if you:
- hire new staff members
- move to a new office with higher rent
- reduce outsourcing tasks
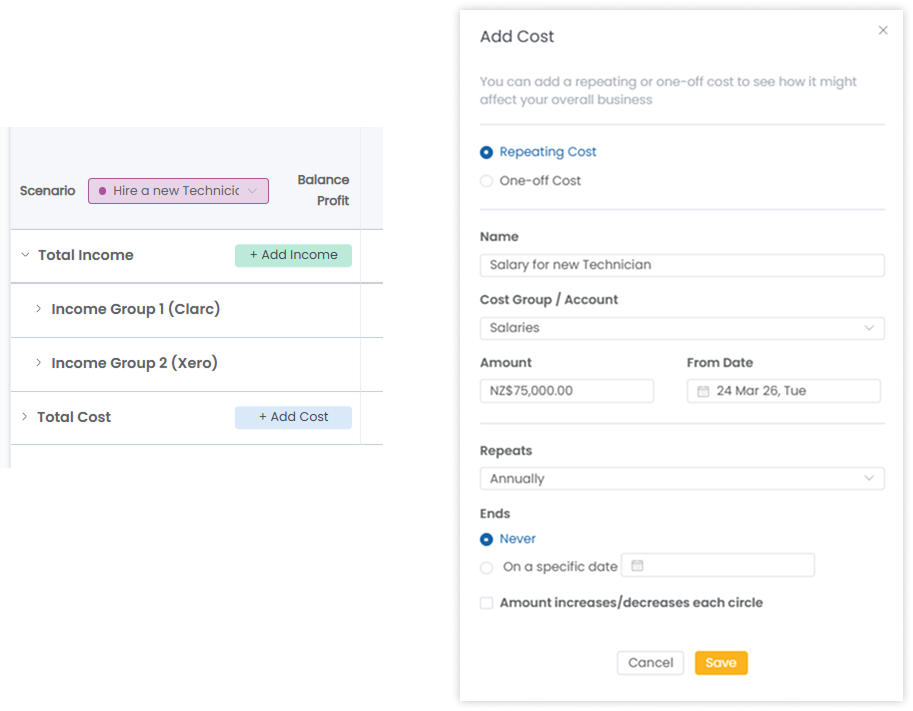
The new scenario will appear on the graph, allowing you to easily compare it with existing data. You can also snap to a specific month to view the corresponding figures.
.png)

Read More
